DataLoom
Full data science lifecycle: data import, ETL, visualization, ML models, and chat interface. Streamlit frontend, Python backend. Scheduled jobs and automation. Received A+ for the project.
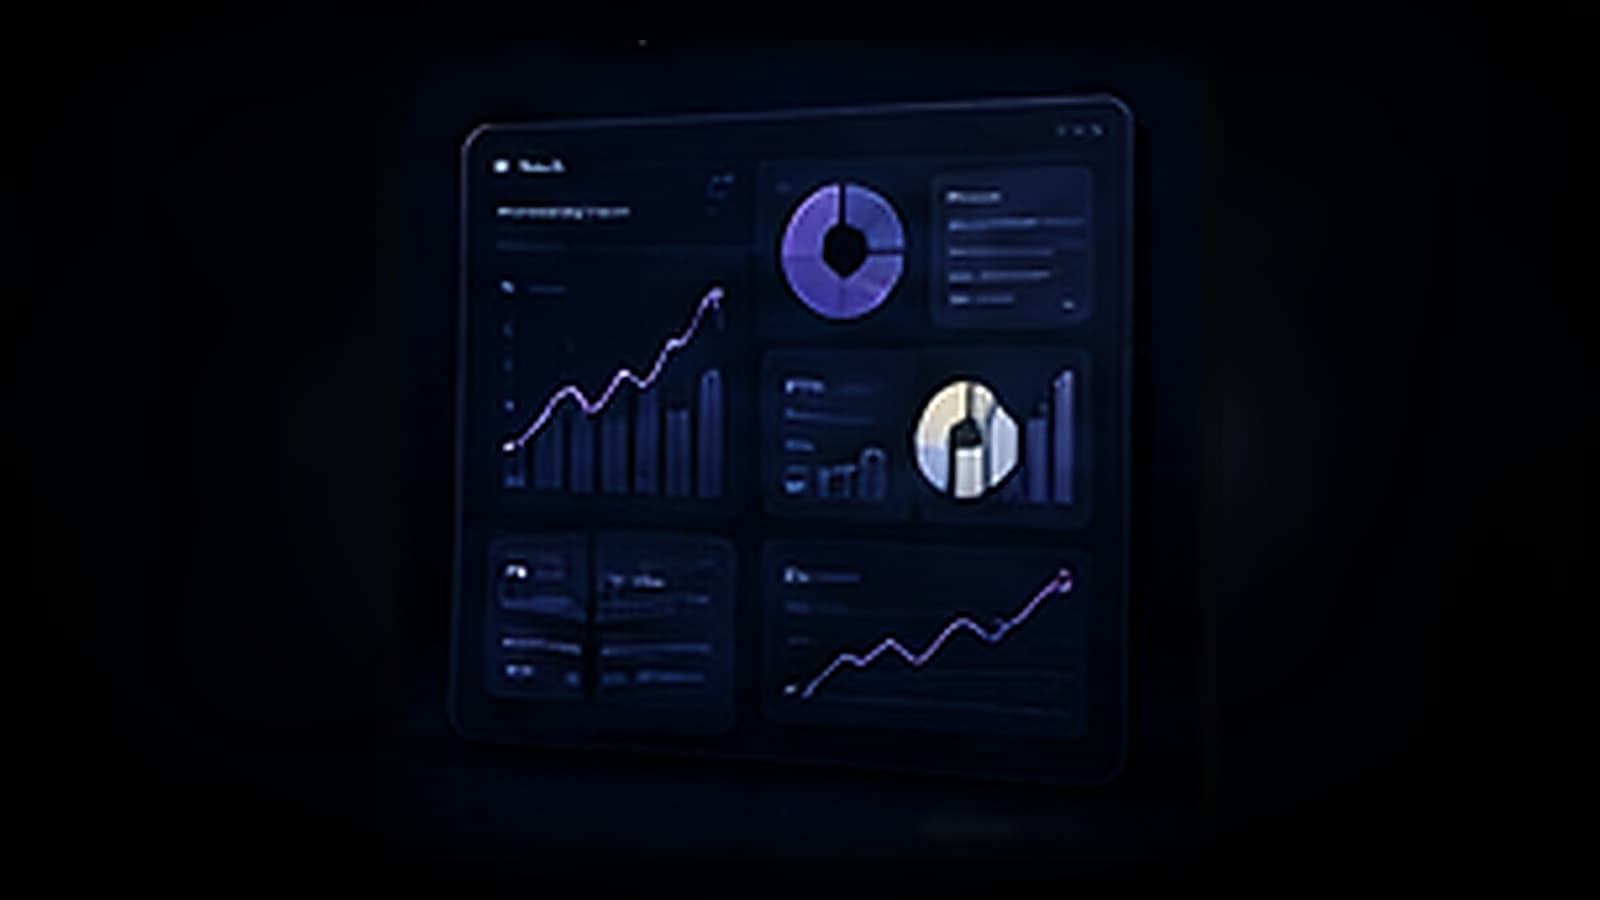
Most student data-science projects stop at a Jupyter notebook. The bar for DataLoom was higher: a real, interactive product that non-technical users could open, load their own data into, and get answers from — including scheduled automation so insights stayed current without manual reruns. It's a full data-science platform covering the complete lifecycle — import, ETL, visualization, model training, and a natural-language chat interface for querying insights — built as a Final Year Project and awarded an A+.
What I Built
- Multi-format data import — CSV, Excel, and database connectors
- ETL pipeline cleaning, transforming, and loading data for downstream analysis
- Interactive visualization layer — charts and dashboards built for exploration, not just static reporting
- ML model training and evaluation wrapped behind a simple UI
- Natural-language chat interface letting users query their data in plain English
- Scheduled automation for periodic data refresh and model retraining
- End-to-end packaging that turned a research-style project into something usable by non-programmers on the team
Tech Stack
- Frontend: Streamlit
- Backend: Python (Pandas, scikit-learn)
- Visualization: Plotly, Matplotlib
- ML: scikit-learn / TensorFlow
- Automation: Cron / Celery-based scheduling
Frontend
- Streamlit-based UI for data upload, exploration, and the chat interface, chosen for how quickly it let a data-science-heavy project become genuinely interactive without a separate frontend build
Backend
- Python service layer handling ETL, model training/evaluation, and the natural-language query interface over Pandas and scikit-learn
Infrastructure
- Cron/Celery-based scheduling for periodic data refresh and model retraining, so insights stayed current without manual reruns
Outcome / Impact
Earned an A+ as a Final Year Project by demonstrating genuine end-to-end data-science capability — from raw data to an interactive, automated, non-technical-user-friendly product.